What we offer our Toolkit
We offer conventional editable tables as well as editable pivot tables to view and manage your data. We support multiple detail levels on the tables enabling you to drill down deeper into the data. Read more…
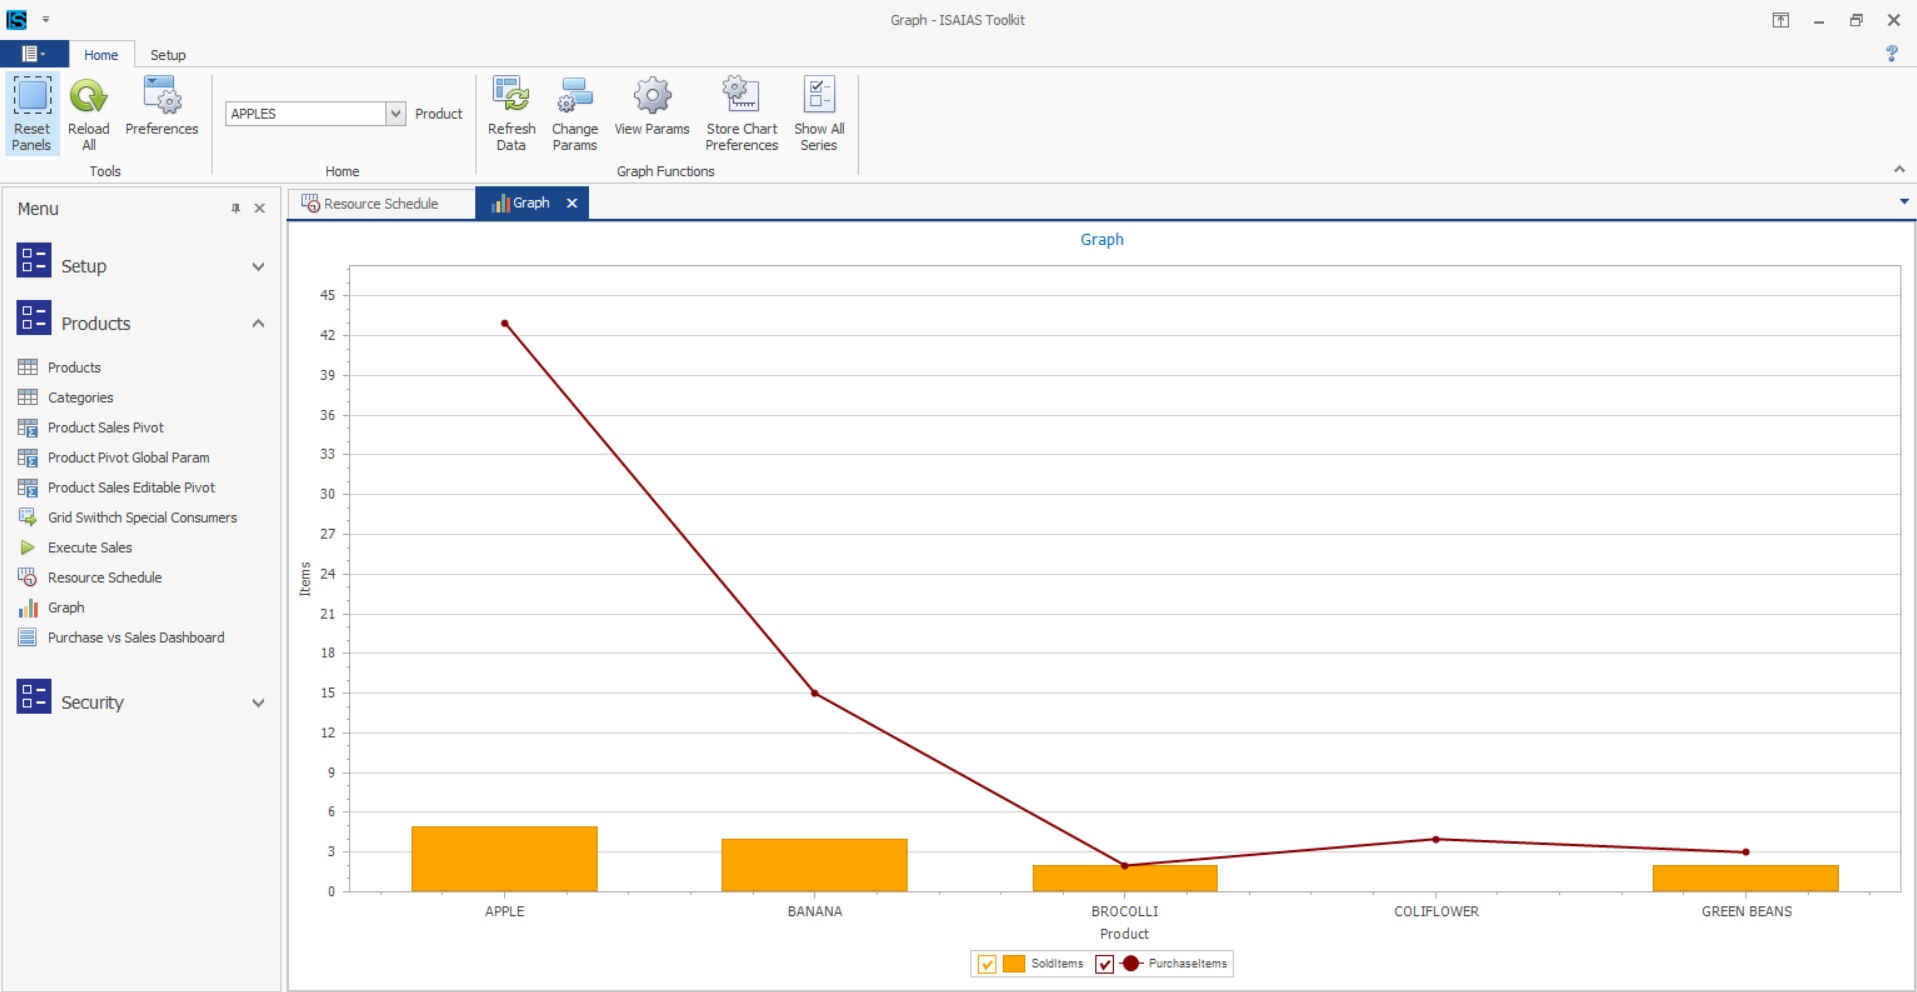
We have various types of graphs and a schedule to visualise your data. We also offer dashboards to combine pivots, tables, and graphs on a single screen. Read more…
We offer various EDA (Exploratory Data Analysis) tools to help you analyse your data and find trends. Normalisation, Correlation, Clustering, and Regression Analysis at your fingertips. Read more…
We create custom optimisers or solvers based on your needs. Watch the progress of the optimiser as it finds and optimises a solution. Read more…
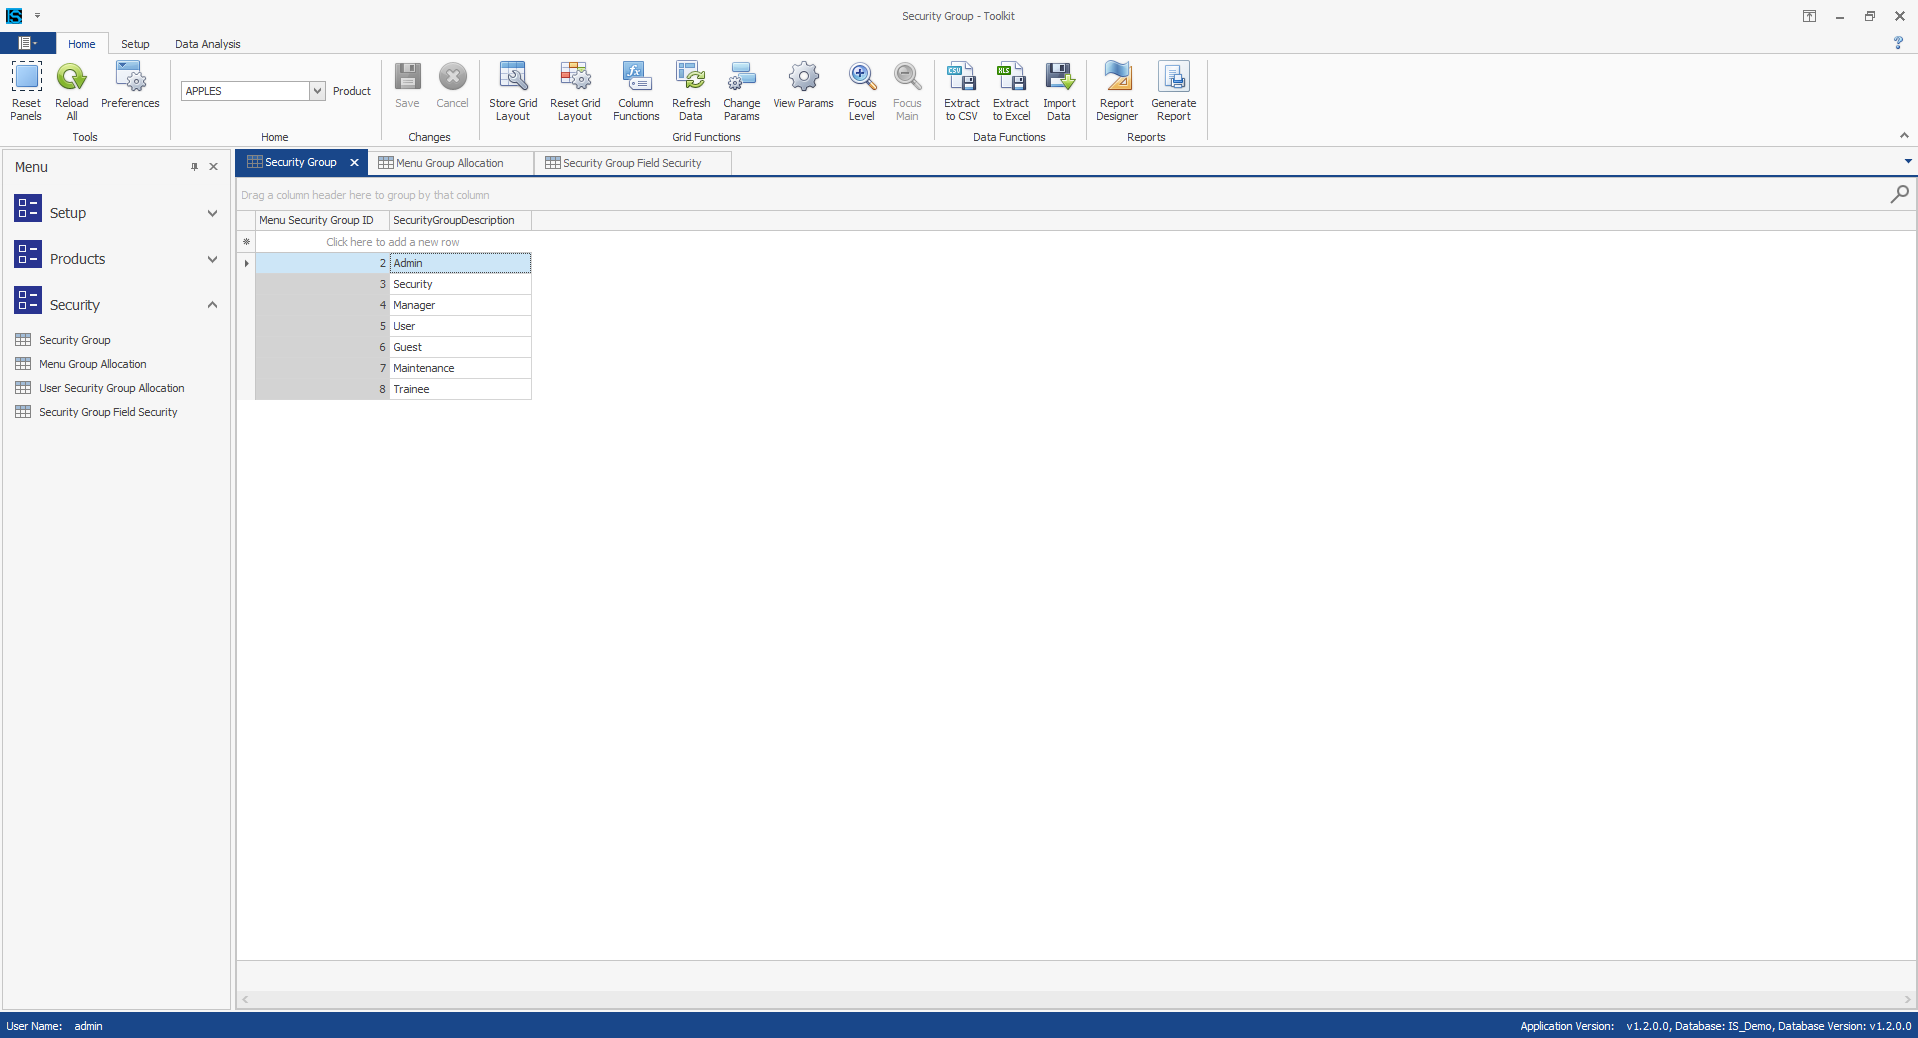
Assign roles to your users to give them access to specific areas within the application. These roles can mirror the users’ roles and functions within your business. Read more…
Management
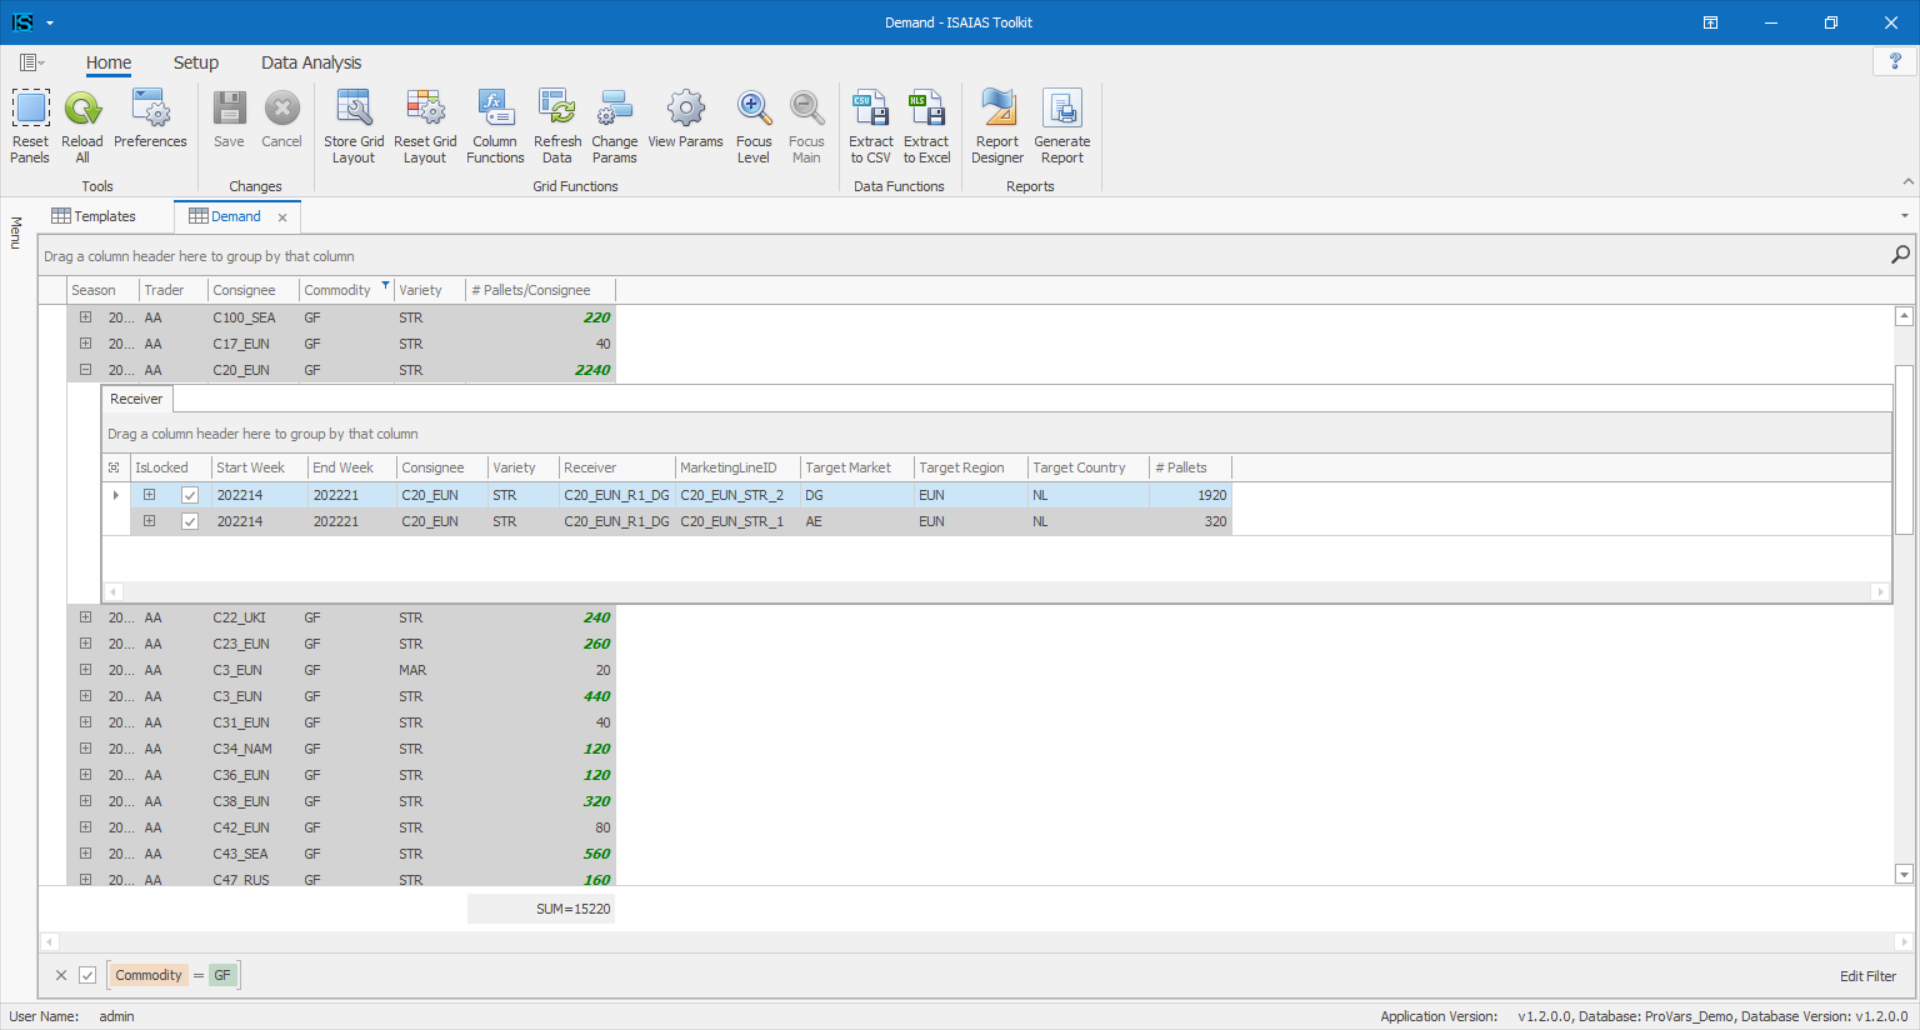
Table:
Insert, edit, and delete data | Detail levels | Conditional formatting | Customise layout | Custom Summaries
Pivot Table:
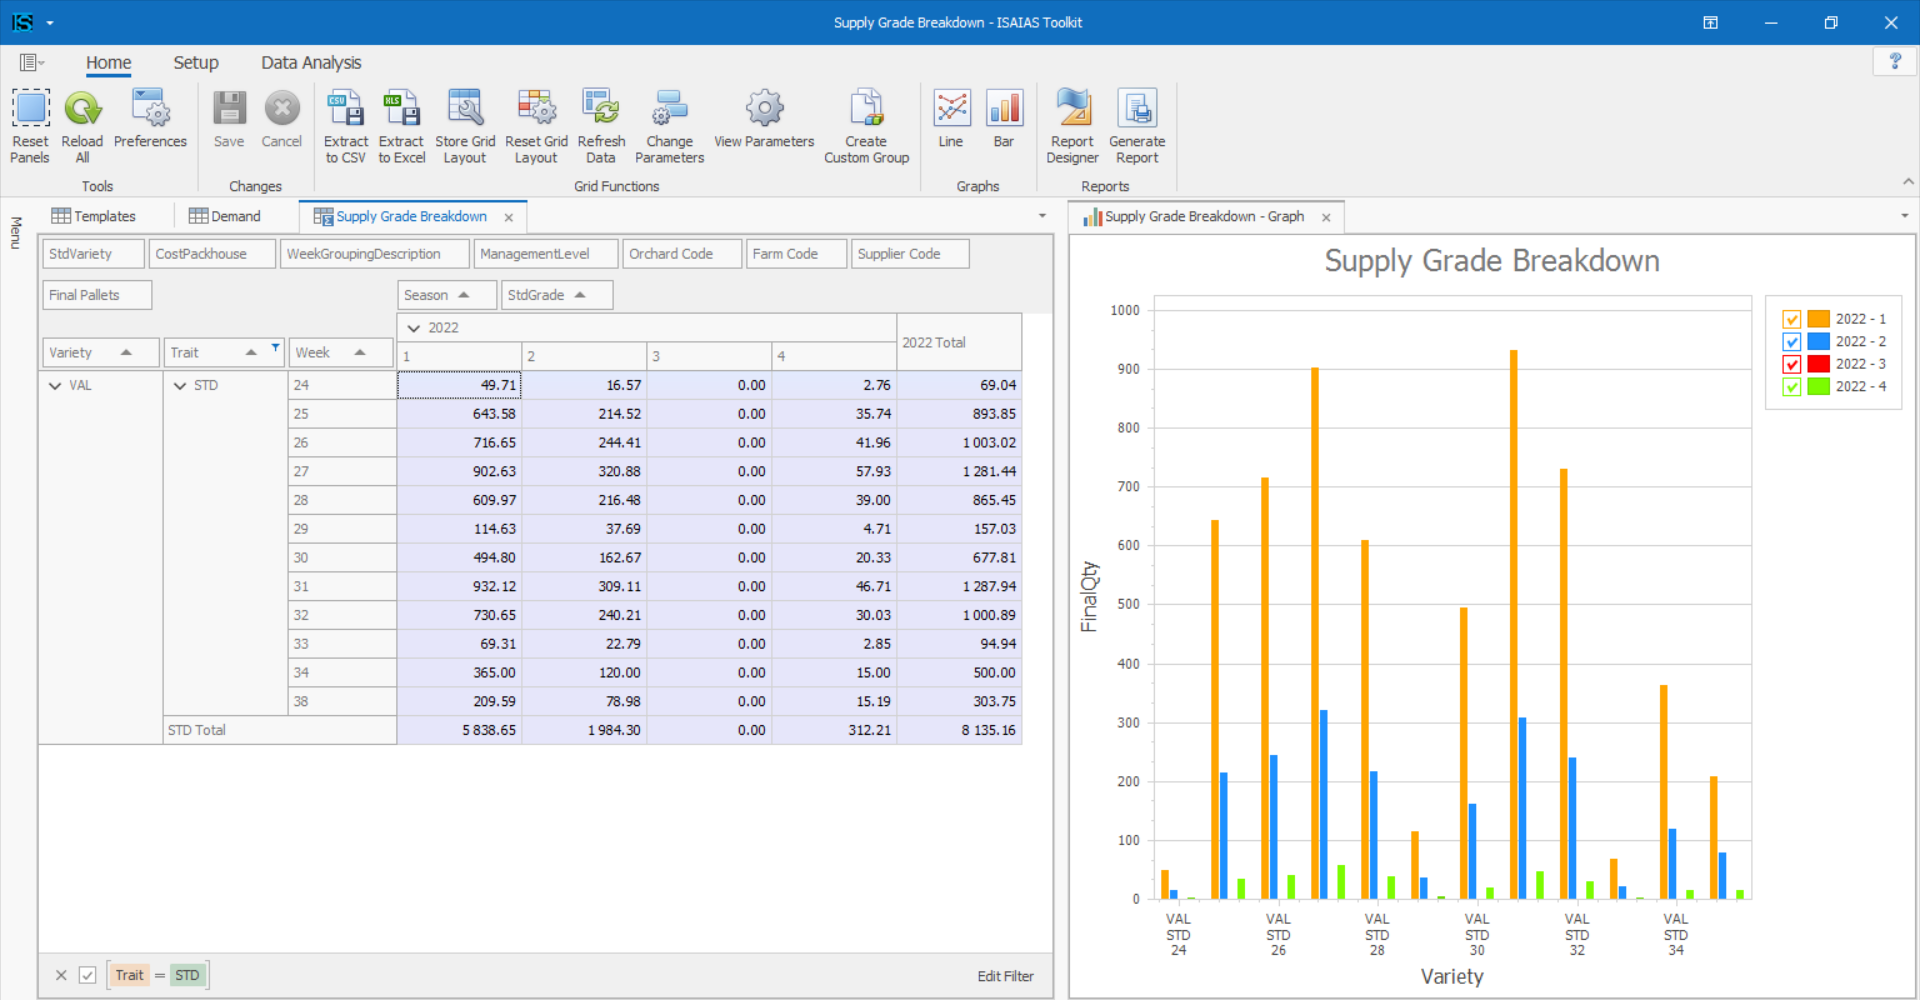
View and edit data | Conditional formatting | Customise layout | View as graph
Visualisation
Graph:
Bar graph | Line graph | Secondary Y-Axis
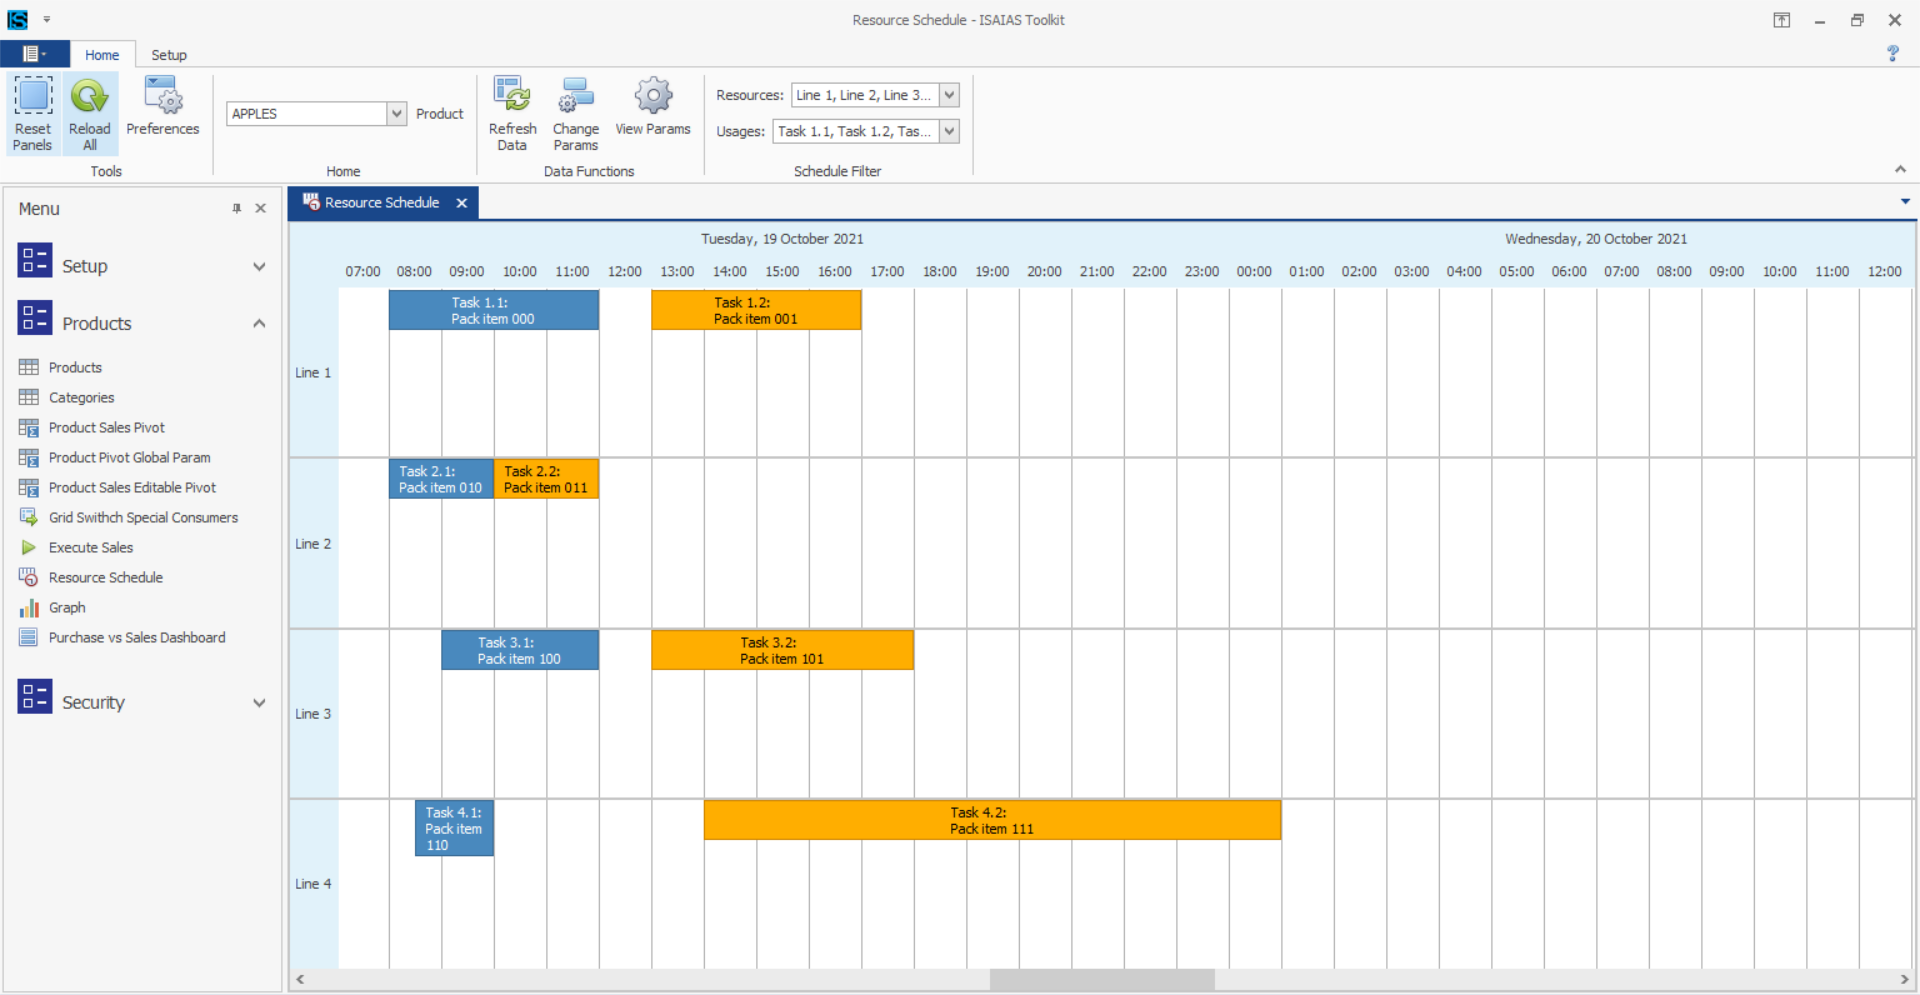
Schedule:
Descriptions with durations | Overlapping events | Multiple resources | Configurable colours
Analysis
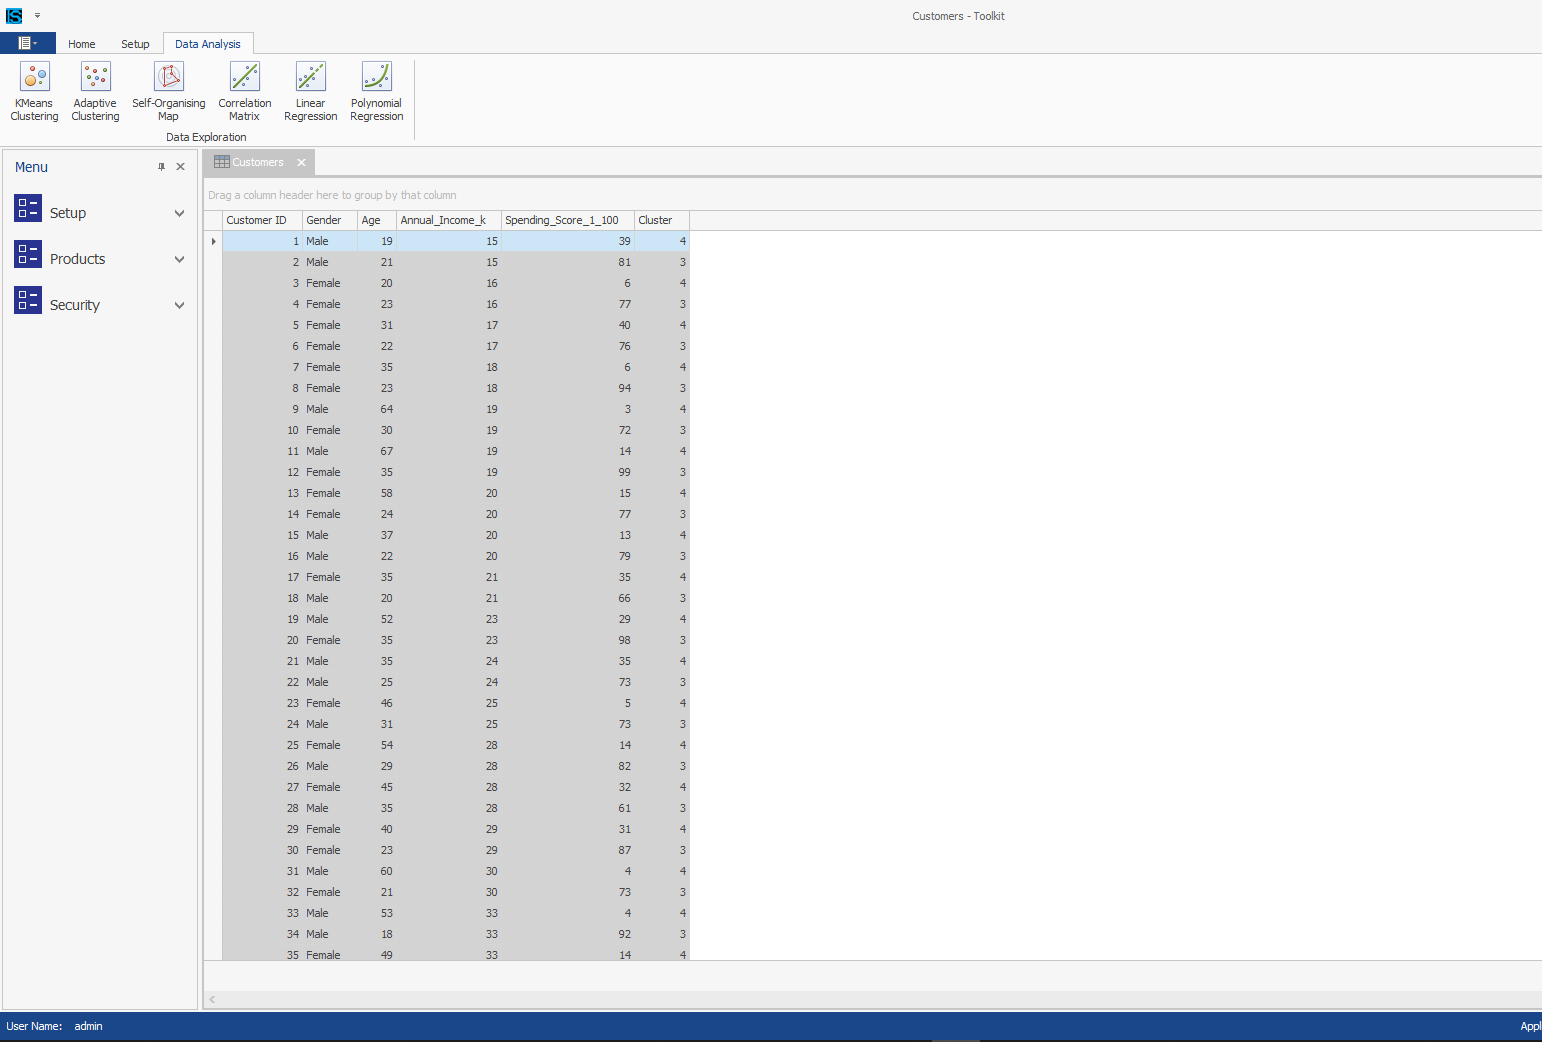
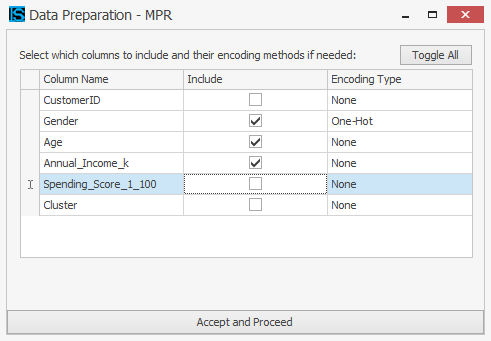
Exploratory Data Analysis (EDA) techniques allow you to explore your data. Most of the techniques support normalisation and various encodings to allow the inclusion of non-numerical data (e.g. One-Hot Encoding for categorical data). We allow you to customise and save the settings for the various techniques so that you can load settings you found to work well in the past.
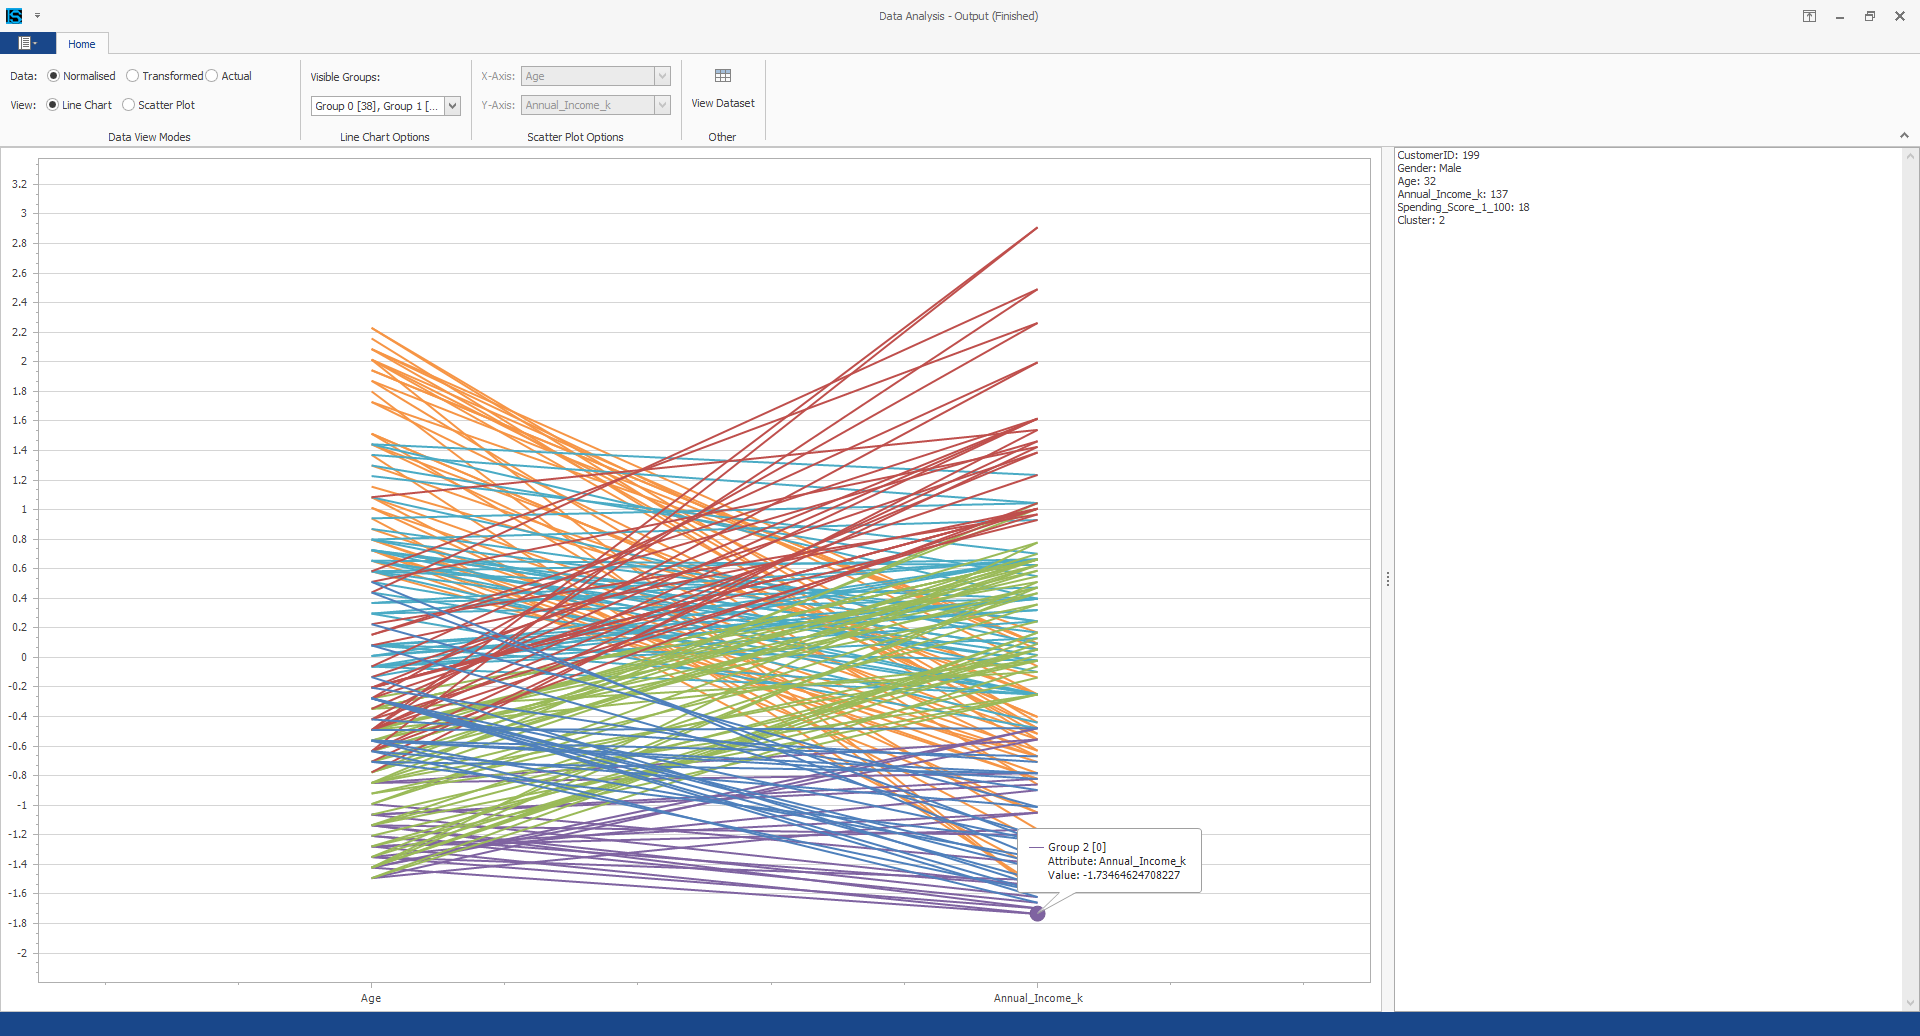
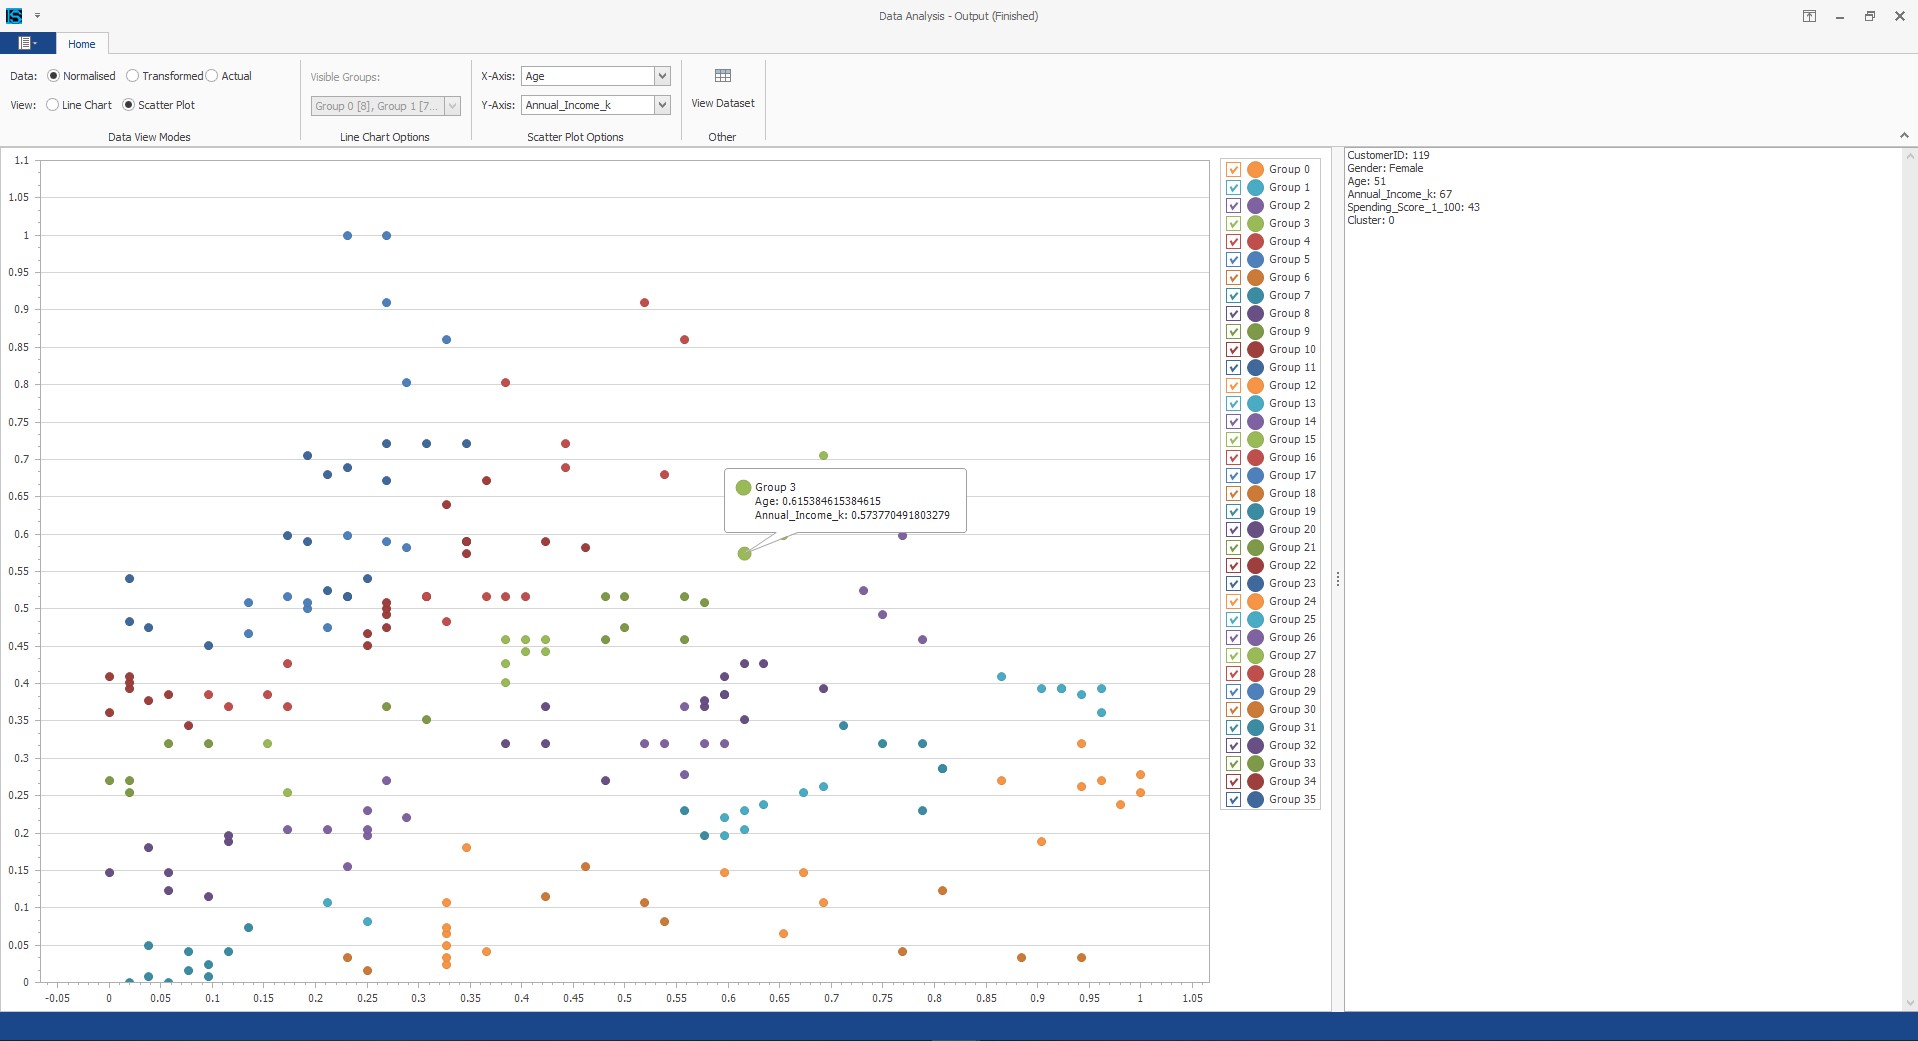
Clustering:
Dynamically group data rows together based on their similarity to one another.
K-Means | Adaptive K-Means | Various Distance Metrics | Various Quality Metrics
Self-Organising Maps:
Similar to clustering in that it groups similar data rows together by moulding around the data
SOM | Additional Clustering
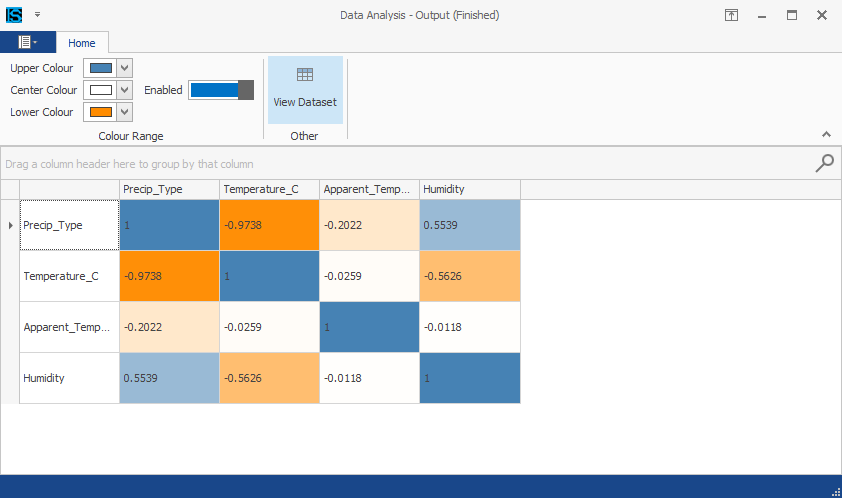
Correlation Matrix:
See the correlation between various attributes (or columns) in your data.
Correlation | Colour Scale
Regression Analysis:
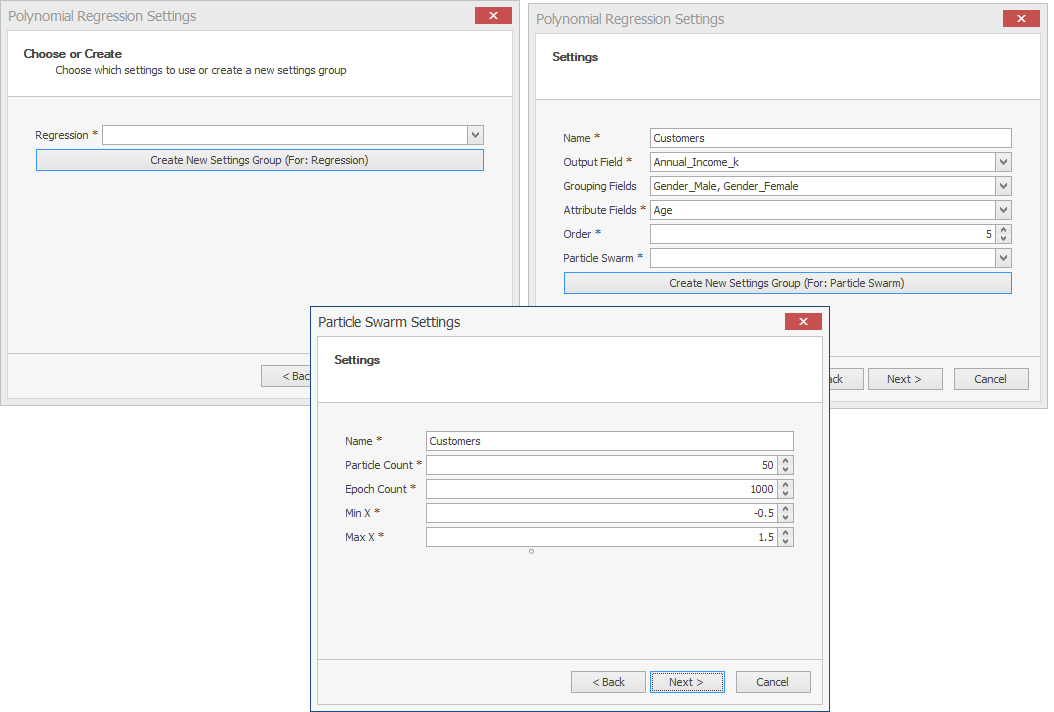
Fit regression lines to your data to predict the output of new or unseen data entries.
Multiple Linear Regression | Multiple Polynomial Regression

Solvers
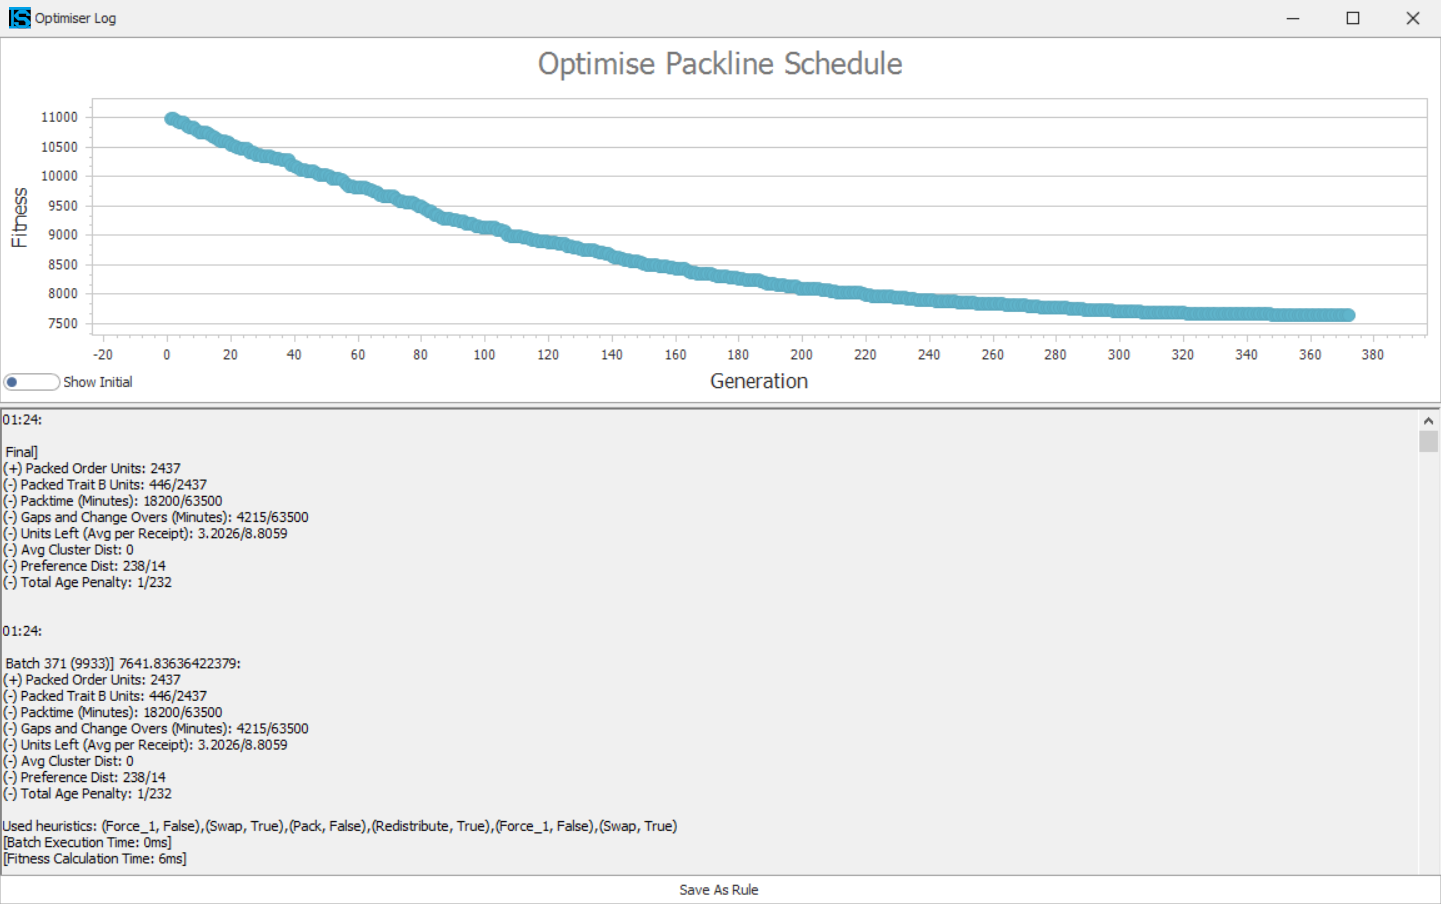
Optimiser (visualiser):
Our custom solvers or optimisers add a layer of Artificial Intelligence (AI) to your project. See in real-time how it is performing as it creates and improves the solution
Hyper-Heuristics | Genetic Algorithms | Linear Search | Multipoint Search
Roles
Role and Access Setup:
Administrators or users with the appropriate role can manage the roles of other users as well as which parts of the app they have access to.
Role-Based Access Control (RBAC)